【通关秘籍第二节】通俗易懂的BI级专业数据报告

来源:满意吧 作者:小满 日期:2020-11-12
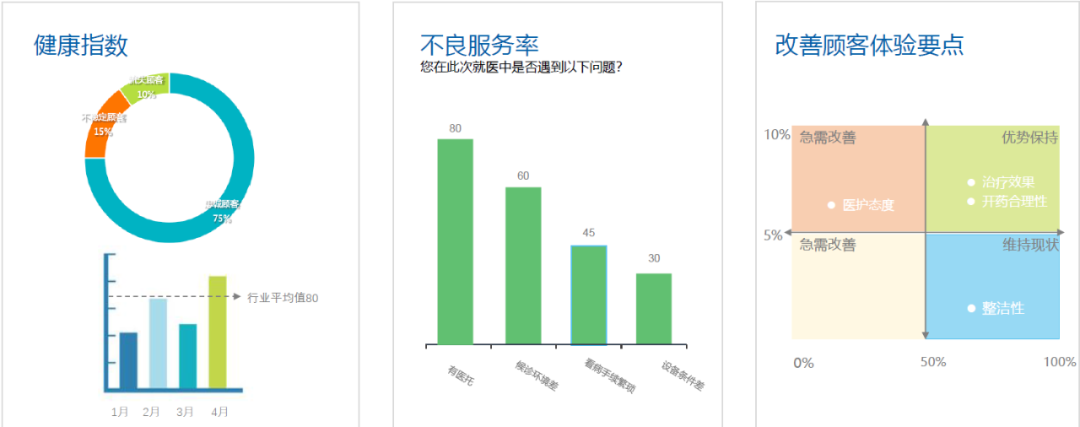
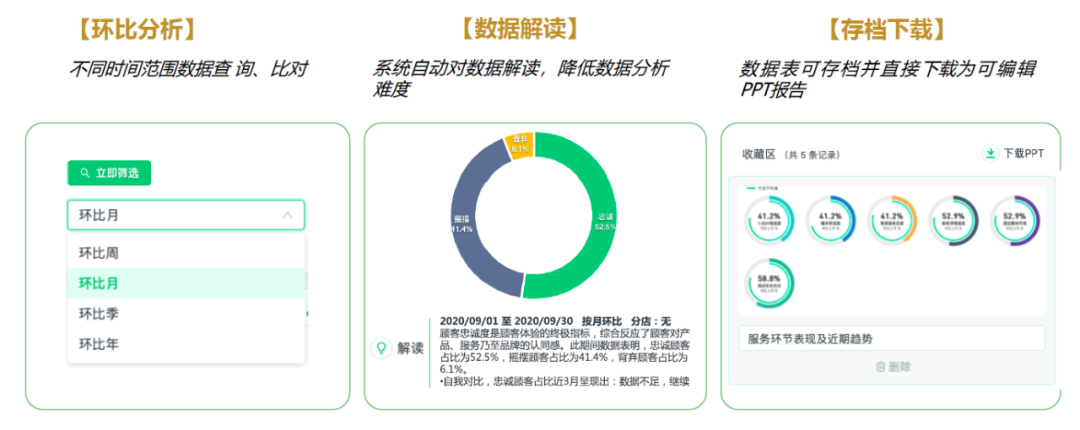
<p><span style="color: rgb(0, 0, 0);">最近,天津某医美机构通过满意吧平台做了一次顾客的满意度调查,完全颠覆了企业之前的调研模式,不仅省时省力,还获得了特别有价值的数据报告。</span></p><p><br></p><p><span style="color: rgb(0, 0, 0);">由于经费有限,企业之前一直是由行政牵头自己做调研,没有与第三方机构合作过。大致的调研流程如下:</span></p><p><strong style="color: rgb(0, 191, 103);">搜集模板</strong></p><p>行政负责人会搜索一些行业调研模板;</p><p><strong style="color: rgb(0, 191, 103);">编辑修改</strong></p><p><span style="color: rgb(0, 0, 0);">在以往做过的模板基础上进行添加和修改;</span></p><p><strong style="color: rgb(0, 191, 103);">问卷下发</strong></p><p><span style="color: rgb(0, 0, 0);">线下连锁店打印成纸质问卷,下发给顾客;</span></p><p><strong style="color: rgb(0, 191, 103);">样本回收</strong></p><p>回收问卷,每天需人工录入上百份问卷,一人录入,一人核对,遇到字迹不清晰的,还需要连蒙带猜。</p><p><strong style="color: rgb(0, 191, 103);">数据统计</strong></p><p><span style="color: rgb(0, 0, 0);">需要有excel功底的调研人员,将录入的样本信息再进行数据统计和整理。</span></p><p><span style="background-color: rgb(238, 237, 235);"><img src="data:image/gif;base64,iVBORw0KGgoAAAANSUhEUgAAAAEAAAABCAYAAAAfFcSJAAAADUlEQVQImWNgYGBgAAAABQABh6FO1AAAAABJRU5ErkJggg=="></span><img src="https://cem-myb-boss-prod.oss-cn-beijing.aliyuncs.com/2020/11/23/uoqRN1l3GFjwbXVMD2P-Jn3zmHylYeyyS38Vo4B.jpg"></p><p><br></p><p><strong style="color: rgb(0, 191, 103);">为什么这里只能称为数据统计整理不能称为数据分析呢?</strong></p><p><span style="color: rgb(0, 0, 0);">因为这个数据整理的过程仅</span>仅局限于基础数据,也就是只统计了每道题回答的人数、平均分数和各选项占比。</p><p><span style="color: rgb(0, 0, 0);">&nbsp;</span></p><p><strong style="color: rgb(0, 191, 103);">这种传统的调研方式,有什么弊端呢?</strong></p><p><span style="color: rgb(0, 0, 0);">首先,人工录入用户答题信息,费时费力不说,</span><span style="color: rgb(144, 251, 217);">出错概率还大</span><span style="color: rgb(0, 0, 0);">;</span></p><p><span style="color: rgb(0, 0, 0);">其次,线下纸质</span><span style="color: rgb(144, 251, 217);">样本回收困难</span><span style="color: rgb(0, 0, 0);">,回收率偏低;</span></p><p><span style="color: rgb(0, 0, 0);">第三,</span><span style="color: rgb(144, 251, 217);">基础数据整理</span><span style="color: rgb(0, 0, 0);">,只能让你从</span><span style="color: rgb(144, 251, 217);">单一</span><span style="color: rgb(0, 0, 0);">的问卷题目中找到某个点的问题所在。</span></p><p><span style="color: rgb(0, 0, 0);">而满意吧平台拥有全流程自动化智能数据分析系统,问卷填写和回收全部在线完成,更精准更高效,智能数据分析可以帮助你发现问题并获取改进的行动方案,同时通过智能客群的分类,让你实现调研结束的同时营销开始。</span></p><p><span style="color: rgb(0, 0, 0);">&nbsp;</span></p><p><strong style="color: rgb(0, 191, 103);">满意吧的数据报告到底强大在哪?</strong></p><p><span style="color: rgb(0, 0, 0);">上一节,关于满意吧题库和模板的专题中就有介绍,问卷设计时我们就预先考虑了数据报告的计算和呈现,通过专业的问卷来反馈有价值的数据报告,0经验也能看懂。</span></p><p><br></p><p><img src="https://cem-myb-boss-prod.oss-cn-beijing.aliyuncs.com/2020/11/23/IGxcig8yIIMLnpXwZkw-So91hyWRqwMANmgoilK.jpg"></p><p><br></p><p><strong>01</strong></p><p><strong>7大类20维度数据报告,一秒生成</strong></p><p><br></p><p><span style="color: rgb(0, 0, 0);">7大类包括boss看板、基础报告、诊断报告、kpi绩效测评、顾客画像、顾客之声、分店报告。</span></p><p><span style="color: rgb(0, 0, 0);">全部可视化数据图表展现,清晰易懂。</span></p><p><span style="color: rgb(0, 0, 0);">平台通过智能模型算法,提升数据解析精准性。</span></p><p><img src="https://cem-myb-boss-prod.oss-cn-beijing.aliyuncs.com/2020/11/23/6hwTCc7l0H9uqFf7Cbl-EZ5vn0QIjfSsR9XHHBp.jpg"></p><p><br></p><p><strong>02</strong></p><p><strong>Boss看板,实时掌控企业全貌</strong></p><p><br></p><p><span style="color: rgb(0, 0, 0);">企业管理层和老板们没有时间耗在海量基础数据中,怎么样才能让老板通过满意度调查快速掌握企业全貌?</span></p><p><span style="color: rgb(0, 0, 0);">boss看板将整体11项关键性指标实时同步,并提供数据异常警示,直接在线查看或一键生成ppt。</span></p><p><img src="https://cem-myb-boss-prod.oss-cn-beijing.aliyuncs.com/2020/11/23/u0EeOt8zTyvm7eZWkLw-ysokaJAw1VvV49C8xeS.jpg"></p><p><br></p><p class="ql-align-justify"><br></p><p><strong>03</strong></p><p><strong>专业诊断报告,洞察企业问题</strong></p><p><br></p><p><span style="color: rgb(0, 0, 0);">专业诊断报告包括:总体满意度、顾客忠诚度、回头客指数、净推荐值(NPS)、客群健康指数、服务环节评测、改善顾客体验要点、不良服务监测。</span></p><p><span style="color: rgb(0, 0, 0);">这些深度的数据分析能更清晰呈现企业问题,提供针对性解决方案。</span></p><p><br></p><p class="ql-align-justify"><img src="https://cem-myb-boss-prod.oss-cn-beijing.aliyuncs.com/2020/11/23/ZzY6s4IxzmNfbNjNt9B-yDZP2tlFMeqSJWrsBRl.jpg"></p><p class="ql-align-justify"><br></p><p><strong>04</strong></p><p><strong>全旅程、多场景监测快速诊断服务环节长短版</strong></p><p><br></p><p class="ql-align-justify"><span style="color: rgb(0, 0, 0);">打通各环节数据,实现更全面的分析和对比;</span></p><p class="ql-align-justify"><span style="color: rgb(0, 0, 0);">从每个场景和环节各自割裂的数据孤岛,到全流程数据整体监测、分析;</span></p><p class="ql-align-justify"><span style="color: rgb(0, 0, 0);">当然不同场景可分别调研,数据连贯,实现可持续性分析。</span></p><p class="ql-align-justify"><img src="https://cem-myb-boss-prod.oss-cn-beijing.aliyuncs.com/2020/11/23/7uQUb0t6hDNyiftJrx1-HG6QmJQKRkNPYiXptoR.jpg"></p><p><br></p><p><br></p><p><strong>05</strong></p><p><strong>行业均值,快速了解行业地位</strong></p><p><br></p><p><span style="color: rgb(0, 0, 0);">从千万级数据中计算不同行业均值,企业可以快速了解自己在行业的地位。知己知彼,才能科学成长。</span></p><p><img src="https://cem-myb-boss-prod.oss-cn-beijing.aliyuncs.com/2020/11/23/6MFLhQM4YHKoNPwPl1N-53YEOiNwIiUr4uFoaoQ.jpg"></p><p><br></p><p><strong>06</strong></p><p><strong>人性化帮助工具,操作更简单</strong></p><p><br></p><p><br></p><p><span style="color: rgb(0, 0, 0);">&nbsp;</span><span style="color: rgb(0, 0, 0); background-color: rgb(144, 251, 217);">环比分析</span><span style="color: rgb(0, 0, 0);">:提供6周期不同时间范围数据查询比对,摆脱excel魔咒。</span></p><p><br></p><p><span style="color: rgb(0, 0, 0);">&nbsp;</span><span style="color: rgb(0, 0, 0); background-color: rgb(144, 251, 217);">数据解读</span><span style="color: rgb(0, 0, 0);">:系统自动对数据解读,降低数据分析难度,哪里不会点哪里。</span></p><p><br></p><p><span style="color: rgb(0, 0, 0);">&nbsp;</span><span style="color: rgb(0, 0, 0); background-color: rgb(144, 251, 217);">存档下载</span><span style="color: rgb(0, 0, 0);">:数据表可存档并直接下载为可编辑的ppt报告,任何时候给老板做汇报都可以从容自如。</span></p><p><img src="https://cem-myb-boss-prod.oss-cn-beijing.aliyuncs.com/2020/11/23/0Csq33yYhrqNbgYlVnm-gzVKOuPZuaqMjlaHZIK.jpg"></p><p><br></p><p><br></p><p><span style="color: rgb(0, 0, 0);">通过满意吧平台,彻底改变传统的纸质调研方式,这不只是一个调研工具,更是用户体验的管理平台。</span></p><p class="ql-align-justify"><strong style="color: rgb(144, 251, 217);"><em>01</em>&nbsp;</strong><span style="color: rgb(0, 0, 0);">不再需要耗费人力和时间通过excel表来统计纸质回收样本数据,全部功能平台化在线完成,简单高效,提交一个问卷后台就实时显示一条数据。</span></p><p class="ql-align-justify"><strong style="color: rgb(144, 251, 217);"><em>02</em>&nbsp;</strong><span style="color: rgb(0, 0, 0);">数据报告更全面,区别于单一基础数据,通过全场景多触点的深度调研,提供多维度的BI数据分析报告。</span></p><p class="ql-align-justify"><strong style="color: rgb(144, 251, 217);"><em>03</em>&nbsp;</strong><span style="color: rgb(0, 0, 0);">数据报告更有价值,不仅发现问题还能提出解决方案,指导企业的下一步的工作重心。</span></p><p><br></p><p><span style="color: rgb(51, 62, 72);">——————</span></p><p><span style="color: black;">想要有效的提升服务质量,提高客户的满意度和好感,就需要仔细了解客户的想法和反馈。</span></p><p><span style="color: black;">满意度调研是最有效的方式,但是往往需要企业耗费太多人力和成本。</span></p><p><span style="color: black;">「满意吧」作为专业的在线</span><a href="https://www.manyibar.com/" rel="noopener noreferrer" target="_blank" style="color: black;">满意度调研</a><span style="color: black;">平台,不仅有效的规避了调研难度和工作量,还让每个企业都能轻松获得专业的满意度调研。</span></p><p><span style="color: black;">超过70个行业的专业题库,多达20维度的自动分析报告,这一切都将令您体验到简洁调研的美妙。</span></p><p><span style="color: black;">&nbsp;</span></p>

了解更多帮助 快速使用免费满意度调查题库和问卷模板

免费使用
满意吧,满意度调查
添加客服微信
领取旗舰版体验券